Website content other than annual reports last updated May 31, 2013.
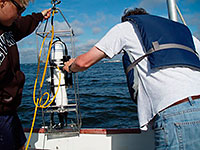
Photo Credit: Narragansett Bay Estuary Program
Monitoring water quality in the bay.
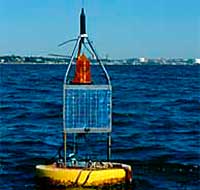
Photo Credit: Narragansett Bay Estuary Program
Narragansett Bay Commission data monitoring bouy.
Learn More!
Data Sources:
The Narragansett Bay Fixed-Site Monitoring Network, along with spatial surveys, is relied upon to provide the data that allows tracking of DO levels and evaluate progress. The stations are located strategically to transect the length of Narragansett Bay and serve as sentinels of changing conditions. The RI DEM Office of Water Resources has taken a lead role in coordinating the multi-agency network effort, and archives the data from the fixed-site monitoring stations. Additional data are available from the following:
- Dissolved oxygen data collected simultaneously from a team of boats on selected dates
- Narragansett Bay Commission’s Upper Narragansett Bay water quality data
- URI Graduate School of Oceanography Marine Ecosystems Research Laboratory (MERL) data for Narragansett Bay
- Additional data are available on NarrBay.org, an on-line portal for Narragansett Bay data.
- In 2012, the Narragansett Bay Estuarine Reserve compiled information on the long term water quality monitoring datasets (Excel spreadsheet) available for the Bay.
- Real time data for the Narragansett Bay National Estuarine Research Reserve through the NBNERR Centralized Data Management Office
Posters
- 2012 Assessment Poster (pdf)
- 2013 Assessment Poster (pdf)
Marine Water Quality
A healthy Narragansett Bay ecosystem supports valuable fisheries and a wide variety of other marine life. Marine water quality is a complex issue that is measured in a variety of ways. In 2012, Watershed Counts focused on dissolved oxygen (DO), just one of many important metrics of marine water quality. Additional metrics are under development.
Oxygen is essential for life. All aquatic organisms depend on dissolved oxygen that is found throughout the water column. But under certain conditions, this essential oxygen can be depleted. Low dissolved oxygen conditions, referred to as hypoxia, impacts the bay’s life. Fish, crabs, shrimp, and shellfish that cannot flee poor water quality conditions become stressed or die. Additional effects ripple throughout the ecosystem.
Marine Water Quality - Dissolved Oxygen: 2013 Assessment
Status and Trends: Narragansett Bay is 148.6 square miles, 140 of which are in Rhode Island. Based on the 2012 RI DEM and MA DEP water quality assessments, 42.1 square miles (28%) in RI and 6.2 square miles (4%) in MA are currently designated as impaired for dissolved oxygen, with 23.6 square miles (16%) unassessed. The remaining 76.7 square miles (52%) are designated unimpaired for dissolved oxygen. Some areas of the Bay are improving, with dissolved oxygen conditions approaching unimpaired.
Management: Many factors influence dissolved oxygen concentrations in the Bay, including weather and circulation patterns, as well as pollutant inputs from the watershed. Of these, we can most effectively manage nutrient over-enrichment from the watershed. We are making progress toward the RI goal of reducing the nitrogen loading to the upper Bay from 11 wastewater treatment facilities by 50% from 1995-1996 levels. Nutrient loadings are decreasing as wastewater treatment facilities upgrade to remove nutrients become operational. The implementation of stormwater regulations and the adoption of low-impact development approaches throughout the watershed will protect rivers and lakes, as well as contribute to improved water quality in the Bay. Monitoring is essential to track the effects of management on marine water quality.
Marine Water Quality - Dissolved Oxygen: 2012 Assessment
Status and Trends: Narragansett Bay is 148.6 square miles, 140 of which are in Rhode Island. Based on the 2010 RI DEM and MA DEP assessments, 47.6 square miles in RI and 6.2 square miles in MA are currently designated as impaired for dissolved oxygen, with 23.6 square miles unassessed. Some areas of the bay are improving, with dissolved oxygen conditions approaching unimpaired.
Management: Many factors influence dissolved oxygen concentrations in the bay, including weather and circulation patterns, as well as inputs from the watershed. We can most effectively manage nutrient over-enrichment from the watershed. We are making progress toward the RI goal of reducing by 50% the pollutant loadings of nitrogen to the upper Bay. Nutrient loadings are decreasing as wastewater treatment facilities continue to upgrade to remove nutrients. The implementation of stormwater regulations and the adoption of low-impact development approaches throughout the watershed will protect rivers and lakes, as well as contribute to improved water quality in the Bay. Monitoring is essential to track the effects of management on marine water quality.
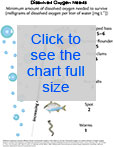
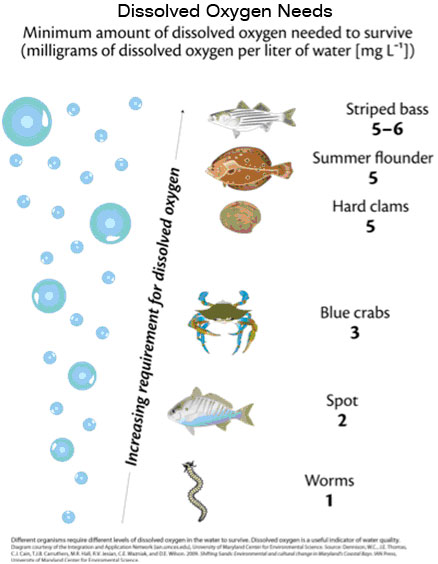
Chart of the dissolved oxygen needs of various types of marine organisms.
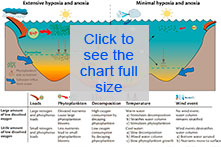
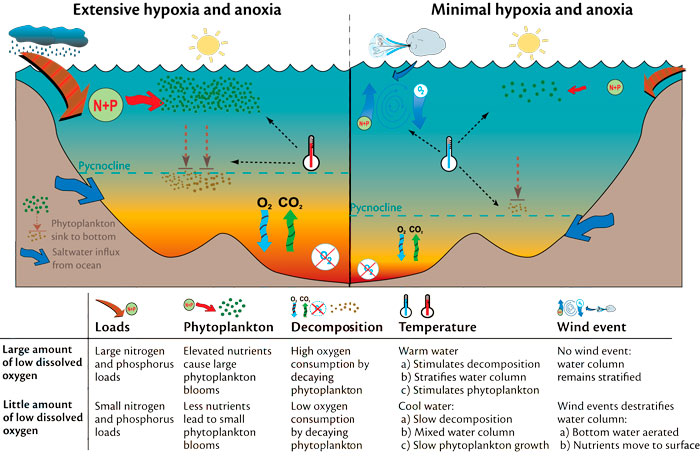
Comparison of extensive and minimal hypoxia and anoxia.
Map of dissolved oxygen imparement in Narragansett Bay.
A healthy Narragansett Bay supports valuable fisheries and a wide variety of other marine life. Marine water quality is a complex issue and requires monitoring a range of aspects. In 2013, Watershed Counts updated dissolved oxygen (DO), just one of many valuable metrics of marine water quality. Additional metrics are still under development and will be unveiled in future years.
If low DO concentrations occur during the period when organisms are in their infant stages and most vulnerable (recruitment season; May through October), it can severely impact marine organism development and life. The effects on finfish and shellfish populations have implications for commercial fisheries and the state’s economy. The State of Rhode Island established DO criteria for saltwaters, including Narragansett Bay, to protect marine life. When those criteria are exceeded in a section of the Bay, that section is designated as “impaired” for DO. If average daily DO concentrations fall below a certain threshold (2.9 mg/L), the water is considered “hypoxic”, and if such conditions persist only the most tolerant forms of marine life are able to survive. If DO concentrations fall close to zero, the water is considered “anoxic”.
Many factors affect DO concentrations in the Bay:
- Weather (rainfall, temperature, wind)
- Circulation patterns (tides, flushing rates, and currents)
- River flows into the Bay from the watershed
- Discharges, both point and non-point, that result in nutrient over-enrichment
- Point discharges include wastewater treatment facilities
- Non-point discharges include stormwater runoff from developed and agricultural lands
Low dissolved oxygen levels are considered one symptom of eutrophication in estuaries. (Bricker et al., 2007) Nutrient over-enrichment, particularly nitrogen (N), contributes to over-production of algae in estuaries. Excess algae die, sink to the bottom and decompose, a process that consumes a lot of oxygen. Stratification of the water column then prevents oxygen in the air from reaching the saltier bottom waters. The map depicting DO impairment was refined this year to reflect the range of severity in hypoxia that occurs in Narragansett Bay based on state water quality assessments. Overall, the monitoring data used to assess the Bay indicates that approximately 32.5% of Narragansett Bay is impaired for low DO. The waters of upper Narragansett Bay and certain cove areas are most impacted by N enrichment and stratification, and therefore, experience the most extreme hypoxic conditions. The estuarine Seekonk River tends to experience the most serious and consistent low DO. Conditions improve down the Bay along a north to south gradient. Western Greenwich Bay also is prone to low DO throughout the recruitment season (May through October).
Scientists at the University of Rhode Island Graduate School of Oceanography (URI-GSO) and other institutions are continuing research to improve our understanding of how various factors contribute to the formation of hypoxia in Narragansett Bay. They have documented that hypoxic conditions vary year to year and are influenced by weather patterns (rainfall and temperature). Their work has established correlations between higher river flows driven by rainfall events to poorer water quality conditions. It is thought that higher river flows both increase the delivery of nutrients to the bay and intensify stratification of the water column (Codiga et al., 2009). Stratification occurs when fresh water, which is less dense than the heavier salt water, forms a layer over the seawater. This layering effect prevents oxygen in the air from reaching the salt water, therefore reducing DO concentrations in the water. While this general pattern exists for much of the bay, Greenwich Bay was found to function differently with conditions strongly influenced by other factors including a low flushing circulation pattern.
The factors affecting hypoxia that we can control the most effectively are point and non-point discharges that carry pollutants, such as excess N, to the Bay. A number of management initiatives are underway to abate the impacts of nutrient pollution. For the estuarine Providence and Seekonk Rivers and the upper Bay, a strategy to reduce N loadings from 11 RI wastewater treatment facilities (WWTFs) is being implemented to achieve a goal, of reducing nitrogen loading by 50% from 1995-96 levels1. During 2006, four WWTFs upgraded (Warwick, West Warwick, East Greenwich, Bucklin Point) accompanied by efforts to improve sewer tie-ins. Upgrades at other targeted WWTFs have followed with some projects still in progress. As they became operational the upgrades at RI’s two largest WWTFs, Bucklin Point and Field’s Point, owned and operated by the Narragansett Bay Commission (NBC) have reduced N loadings. The NBC reports it has reduced N discharges by 59% since 2003, the year of the historic Greenwich Bay fish kill, and by 2014 when upgrades are complete, the NBC nitrogen discharges to upper Narragansett Bay will be reduced by over 70% compared to 2003 levels. RI DEM compiled information that shows that overall, RI sewer system ratepayers along with taxpayers are investing over $275 million on the wastewater improvements directly related to addressing nutrient pollution in the upper bay. Data from these WWTFs indicate significant reductions in N loadings are being realized, as well as decreased N concentrations in upper Narragansett Bay. Wastewater treatment facility upgrades are also being pursued in the Massachusetts portion of the watershed draining to upper Narragansett Bay.
In addition to controlling point sources, work is underway in both MA and RI to devise and implement more effective strategies to reduce nutrient pollution from other sources in the watershed including stormwater runoff, septic systems and fertilizer use.
References
Bricker, S., B. Longstaff, W. Dennison, A. Jones, K. Boicourt, C. Wicks, and J. Woerner. 2007. Effects of Nutrient Enrichment In the Nation’s Estuaries: A Decade of Change. NOAA Coastal Ocean Program Decision Analysis Series No. 26. National Centers for Coastal Ocean Science, Silver Spring, MD. 322 ppg.
Codiga, D., H. Stoffel, C. Deacutis, S. Kiernan and C. Oviatt. 2009. Narragansett Bay Hypoxic Event Characteristics Based on Fixed-Site Monitoring Network Time Series: Intermittency, Geographic Distribution, Spatial Synchronicity, and Interannual Variability. Estuaries and Coasts 32: 621-641 DOI 10.1007/s12237-009-9165-9.
1. RI State Law passed in 2004, RIGL § 46-12-2(f).