Website content other than annual reports last updated May 31, 2013.
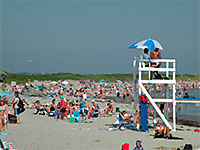
Photo Credit: © Newport Discovery Guide
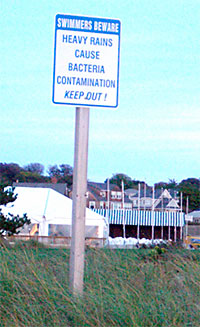
Photo Credit: Save the Bay
Tourist spending, whether by day-trippers or visitors from out of state, forms an important part of Rhode Island's economy. But tourists will not be interested in coming to Rhode Island if the waterways are not clean enough to swim in and boat on.
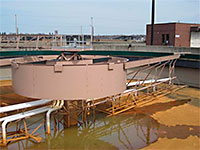
Photo Credit: © 2011 The O'Connell Companies
Sewage treatment facilities, while rarely seen by most people, are an essential part of keeping the waterways clean so they can be used for swimming, boating and other recreational activities.
Learn More!
- Fact Sheet on the Importance of RI Beaches
- Economic Benefits of Protecting Healthy Watersheds
- EPA Fact Sheet on the Economic Benefits of Protecting Healthy Watersheds
Posters:
- 2013 Assessment Poster (pdf)
- 2012 Assessment Poster (pdf)
Presentations
- What is the Value of a Beach: A presentation by Marisa Mazzotta, Ph.D. U.S. EPA - Atlantic Ecology Division

Resource Economics
People throughout the Narragansett Bay watershed reap the benefits of on-going public investments in clean water infrastructure, and the acquisition and protection of lands for maintaining essential natural habitats, parks and recreation areas. Watershed Counts is developing a system to track these investments in environmental improvement and the resulting economic value of a clean environment to citizens of the region.
Narragansett Bay defines so much of the quality of life Rhode Islanders enjoy. Beaches are not just a fun part of a summer day in Rhode Island. They are a significant part of the local and state economy. Here is just one, telling statistic from resource economists:
There are over 20 million “beach visits” in Rhode Island per year. The total social value of these beach days is estimated at over $155 million per year.
The citizens of our state have made significant investments in clean water infrastructure, such as sewage treatment plants and septic systems.
The biggest recent investment is the Narragansett Bay Commission’s combined sewer overflow tunnel, or CSO tunnel, which went on line in 2008. The CSO tunnel captures and treats a mix of raw sewage and polluted stormwater — which includes oil, gasoline, garbage that would otherwise be washed off of our streets and into the Bay when it rains.
The CSO tunnel project cost $359 million. This may be a large investment, but it has made a real difference in Upper Bay, cleaning waters that were, just a generation ago, written off as permanently polluted. Since the tunnel went on-line, nearly 4 billion gallons of polluted water has been kept from the Bay.
The CSO tunnel has reduced sewage bacteria in the Bay. At 3 Upper Bay beaches — Barrington, Bristol and Conimicut Point in Warwick — there was remarkable 82% decrease in beach closure days 2010, compared to 2006, before the CSO project went on line.
Natural Resource Economics: 2012 Assessment
Status and Trends: The state’s economy benefits from a strong travel and tourism sector, and Rhode Islanders benefit from the many outdoor recreational activities supported by the region’s natural assets including beaches, rivers and parks. A significant investment has been made in wastewater infrastructure and open space protection.
Management: Better data are needed to accurately track investments in environmental improvements and the resulting economic and social paybacks.
Respondent households that have a need for various outdoor recreational facilities.1
Various Water-Based Activities that Respondents Have Participated in Over the Past Year.1
Rhode Island Economic Monitoring Collaborative: FY08 Economic Monitoring Report
This report looked at peak season tourism’s impact on the state and the economic linkages between the marine trades and the rest of Rhode Island’s economy.
Recent natural resource economic analyses from the Narragansett Bay Region
The Economic Impact study of Plant-based Industries and Agriculture. University of Rhode Island, Department of Environmental and Natural Resources, 2013:
- Summary fact sheet (pdf)
- Full report available at RI Nursery and Landscape Association web site
Rhode Island Recreational Saltwater Fishing Industry Trends and Economic Impact (pdf), by Ninigret Partners for the RI Saltwater Anglers Assn, 2007
The Economic Value of Narragansett Bay: A Review of Economic Studies (pdf), Andrada I. Pacheco and T. Tyrell, March 2003
Rhode Island Commercial Fishing and Seafood Industries - The Development Of An Industry Profile (pdf), Prepared by the Cornell Cooperative Extension Marine Program: Emerson C. Hasbrouck, John Scotti, Jacqueline Stent, Emerson G. Hasbrouck, Kristin Gerbino, October 2011
Rhode Island Economic Monitoring Collaborative: FY07 Economic Monitoring Report
This report presents a scorecard approach to monitoring, with 28 indicators of the status of Rhode Island’s “water cluster” industries. The cluster includes the water-dependent sector (those who depend on the water or its close proximity for its economic viability, such as marinas, water transportation, boat dealers, and commercial fishing); the water-related sector (where water is a contributing component of the value-added but the industry can exist without it. The industry may also be tied to the water through historical legacy, but over time its dependence on it has lessened. Examples include defense, tourism, and marine trades support industries); and the watershed sector (including employers that rely on large quantities of fresh water in their operations (e.g., bio-manufacturing). The Collaborative defined this sector as industries that use twice the median amount of water per employee.)
Watershed Counts’ economic analysis is based on past studies, including research done by the RI Economic Monitoring Collaborative, which is a standing committee of the RI Bays, Rivers and Watersheds Coordination Team, a group formed by the General Assembly to protect Narragansett Bay and its watersheds, as well as to promote sustainable economic development for businesses that rely on these resources.
With input from a broad range of experts and locally involved organizations, the Collaborative developed two reports intended to help guide future economic development.
1. Source: RIDEM Outdoor Recreation Demand Citizen Survey, Conducted by Leisure Vision, Aug-Oct., 2002 and National Survey of Recreation and Environment 2000, preliminary estimates (from version 1-6: coastal recreation participation, and 2001 participation in marine rec nsre_2).
Workshop Documents (in Adobe Acrobat format)
December 19, 2011 Workshop
- Agenda
- Summary Report
- Presentation: Economic Indicators for RI’s Fresh, Coastal, & Estuarine Waters by Ames Colt, RI Bays, Rivers, & Watersheds Coordination Team
- Presentation: Economic Indicators for Watershed Counts by Marisa Mazzotta, Ph.D., Environmental & Natural Resource Economist
Data:Leisure Vision/ETC Institute (October, 2002)
Data: Leisure Vision/ETC Institute (October, 2002)