Website content other than annual reports last updated May 31, 2013.
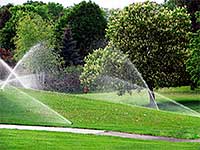
Photo Credit: iStockphoto ©
Demand for freshwater is highest in summer, when stream flow is naturally lowest. Over 50% of the water used is lost to the atmosphere. Water can be used more efficiently.
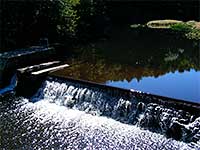
Photo Credit: RI Department of Environmental Management
Several watersheds in Rhode Island are stressed. The photograph above shows the Hunt River at average flow. The photo below shows the same scene when the flow is low.
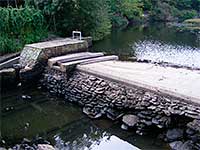
Photo Credit: RI Department of Environmental Management
Learn More!
- RI DEM's Stream Flow Depletion Methodology
- RI Water Resources Board Strategic Plan (pdf) See Appendix D: Water Supply and Demand Estimating
- MA EOEA Division of Ecological Restoration: Stream flow restoration
Data Sources:
- RI Water Resources Board
- Streamflow & groundwater data
- USGS Massachusetts: links to real time flow data and other information
- Additional information
Posters:
- 2013 Assessment Poster (pdf)
- 2011 Assessment Poster (pdf)

Freshwater Flow
Rhode Island has ample rainfall that supports our freshwater system of groundwater aquifers, rivers, streams, and lakes, while providing freshwater as drinking water, as well as for industry, firefighting, and agriculture. However, there is still a limit to this resource. In some suburban communities, summertime demand for water that is suitable for drinking is 2&ndash3 times wintertime usage. And much of this water is used to water lawns — a practice that is now unsustainable. Increasingly in southern RI where the water supply comes from groundwater, more water is taken from the ground than is returned by rain and the watersheds are affected.
Several watersheds in Rhode Island are stressed — essentially they reach drought-like conditions during non-drought years — by the over withdrawal of water. Examples include the Hunt/Potowomut River aquifer in North Kingstown and East Greenwich which provides water supply for North Kingstown, Kent County Water and Quonset; and the Chipuxet watershed in South Kingstown which provides water to URI, Narragansett and South Kingstown, as well as irrigation water to local farms.
In the Narragansett Bay watershed, river flows are affected by water withdrawals. Watershed Counts is using the demand for freshwater as one metric for freshwater flow. We currently have data for Rhode Island and are working to obtain comparable data from Massachusetts.
State of Rhode Island
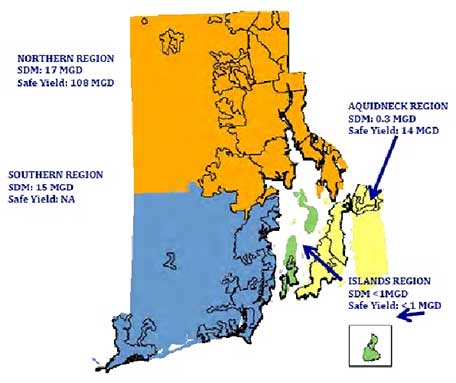
The estimates of demand for freshwater as reported by large public suppliers are available for 2005. It is expected that these data will be updated annually starting in 2014. Data from FY 2010, 2011, and 2012 are currently being compiled. Not included here are estimates of private (self) supply, except in the Islands Region, where they comprise a large portion of the total demand. These are estimated to be fifteen percent consumptive, i.e., eighty five percent is returned to the system via septic systems. In many areas the quantities are not significant, but there are other important considerations1. Effective management of the region’s freshwaters relies heavily on monitoring data derived from stream gages and groundwater monitoring wells. These provide information in real time on the status of freshwater resources, allowing for appropriate planning and response to changing conditions.
Northern Region
Home to eighty percent of the state’s population, this region is primarily served by large public suppliers. Ninety seven percent of the public supply is derived from surface water systems (reservoirs) while Harrisville and Pascoag public supplies are derived from groundwater. During periods with little precipitation, e.g., summer dry spells or longer droughts, freshwater is mostly provided by storage in the public water supply reservoirs. Although the reservoirs are engineered to store enough water to withstand drought conditions, prudent long-range planning and management require managing demand and augmenting supply to safeguard the state’s water supplies.
2005 Public Supply Average Daily Demand (million gallons/day, or MGD)
| Bristol County Water Authority | 3.7 |
| Cumberland Water District | 2.7 |
| Harrisville & Pascoag | [0.6]2 |
| Kent County Water Authority | 11.0 |
| North Smithfield | 0.1 |
| Pawtucket | 12.3 |
| Providence Water Supply Board | 60.9 |
| Woonsocket | 5.6 |
| Total Northern Region | 96.3 |
| Reservoir Safe Yield3 | 107.6 |
| Average Daily Demand Over/Under | 11.4 |
| Peak Summer Demand Over/Under | -17.54 |
(Note: Strict comparisons of summer demand to reservoir safe yields are not applicable due to reservoir storage)
Southern Region
Seventy percent of the Southern Region is served by public supply, with the remaining 30% provided by private (self) supply. All freshwater supplies come from groundwater or direct stream withdrawals. Storage is minimal, limited to surplus water stored in aquifers, public supply tanks, distribution systems, and farm ponds. During periods of little rain, water is taken from streamflow as groundwater is depleted. During extended dry periods, rivers and streams can be further impacted as supply is withdrawn from deeper groundwater storage. The Southern Region is a summer tourist destination and also is home to farms and residential development. During dry summer months, increased demand to support tourism, agriculture and residential uses, combined with limited storage, means increased competition and the need for coordinated planning and management.
2005 Public and Self-Supply Average Daily Demand (million gallons/day, or MGD)
| North Kingstown | 4.0 |
| Richmond | 0.1 |
| Quonset Development Corp (QDC) (NK) | 0.7 |
| Kingston Water District | 0.4 |
| United Water5 | 2.8 |
| URI | 0.7 |
| Westerly | 3.3 |
| Combined Private (self) supply | 5.3 |
| Total Southern Region | 17.3 |
| Resource Protection Goal6 | 15.3 |
| Average Daily Demand Surplus/Deficit | -2.0 |
| Summer Surplus/Deficit | -12.3 |
Aquidneck Region
This region includes Newport, Middletown, Portsmouth, Tiverton and Little Compton. The population relies primarily on public supply (82%), mostly from surface water supplies (78%).
2005 Public Supply Average Daily Demand (million gallons/day, or MGD)
| Newport Water | 7.2 |
| Stone Bridge & North Tiverton | 0.8 |
| Total Aquidneck Region | 8.0 |
| Reservoir Safe Yield3 | 14.1 |
| Average Daily Demand Over/Under | 6.1 |
| Summer Surplus/Deficit | 4.5 |
Island Region
To acknowledge their unique characteristics and challenges related to water supply and water resource management, several islands in Rhode Island are aggregated into the Islands Region. These include Jamestown, Block Island (New Shoreham), Prudence Island, Patience, Hope and Hog Islands. Of these, Jamestown, New Shoreham, and Prudence Island all have public suppliers in addition to self supply.
2005 Public and Self-Supply Average Daily Demand (million gallons/day, or MGD)
| Jamestown Public | 0.2 |
| Jamestown Self | 0.2 |
| New Shoreham Public | 0.1 |
| New Shoreham Self | 0.2 |
| Prudence Island Public | <0.1 |
| Prudence Island Self | NA |
| Total Islands Region | 0.8 |
| Resource Protection Goal | Varies by island |
All data and descriptions above are from the Rhode Island Water Resources Board 2012 Strategic Plan (pdf)
Footnotes:
1. Considerations for self supply include where the water is being drawn from, where it is returned, water quality, and population density.
2. Not included in the total because water is drawn from groundwater and therefore would not be included in the “Reservoir Safe Yield” calculation.
3. Amount above which withdrawal may pose a risk to the resource if drought occurs.
4. Current and projected summer demands exceed safe yield, however, the increased peak demands are currently met by available storage and capacity which is reflected in the average data.
5. Includes Narragansett and South Kingstown (Middlebridge and South Shore).
6. Amount above which withdrawal poses a risk to the resource.
Freshwater Flow: 2013 Assessment
| Region | Status and Trends | Management | |
| Northern RI: While there are concerns about over-reliance on the Scituate Reservoir, the system is relatively resilient because of interconnections. | Issues: Infrastructure; Maintenance; Redundancy/backup. | ||
| Southern RI: Management is needed and there is movement in the right direction, but further reductions in demand will not be achieved without more action. Recently water demand has stabilized, likely due in part to slower economic activity. | Issues: Decentralized management; Dependence on groundwater means increased competition for limited resources during dry periods. | ||
| Aquidneck: Communities are facing major challenges due to sea level rise and and water quality, but they are managing well. | Issues: Sea level rise and proximity of water supply to the ocean; Water quality; Limited water resources and alternatives. | ||
| Islands: The islands are unique in the range of issues they face to protect and maintain very limited fresh water supplies. | Issues: Limited water resources and alternatives; Jamestown and Block Island have taken leadership roles in effective water management; Prudence Island is also addressing water use. | ||
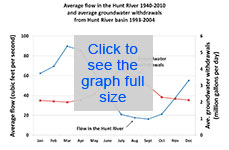
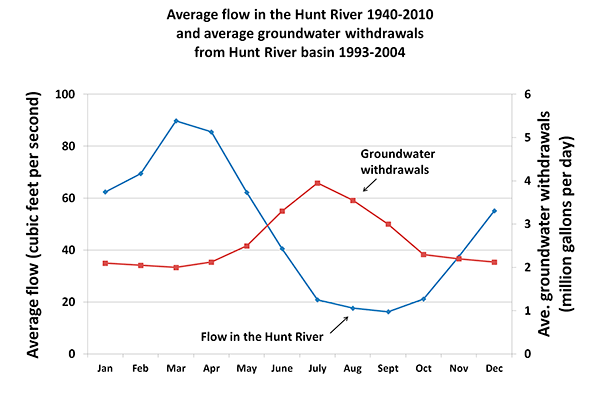
This graph compares the average monthly flow volume in the Hunt River with the average monthly water withdrawels. The data come from the average flow in the Hunt River from 1940 to 2010 and the average groundwater withdrawels from the Hunt River basin from 1993 to 2004.
Freshwater Flow: 2011 Assessment
Status and Trends: In some areas, freshwater rivers and streams are stressed by over withdrawal of water.
Management: RI's Legislature has given DEM and the Water Resources Board the mandate to sustainably manage our shared water resources to provide water for essential human uses, economic development and ecological health. Continued implementation is needed.
Workshop Documents (in Adobe Acrobat format)
- January 8, 2013 meeting on Freshwater Quality and Flow Indicators:
- Agenda
- Flow and Freshwater Quality, a presentation by Meg Kerr, NBEP
- Cyanobacteria in Northeast Lakes, a presentation by Bryan Milstead, US EPA
- Freshwater Quantity and Demand, a presentation by Q Kellogg, URI Coastal Institute
- Mapping Aquatic Invasives, a presentation by Katie DeGoosh, RI DEM, Office of Water Resources
- November 19, 2010 meeting on Freshwater Flow:
- Agenda
- Summary Report
- Freshwater flow indicators used by other programs by Lesley Lambert (NBEP)
- RI Water Resources Board work on freshwater flows by Kathy Crawley (RIWRB)
- All About Stream Flow by Alisa Richardson (RIDEM OWR)
Data: Rhode Island Water Resources Board