Website content other than annual reports last updated May 31, 2013.
Learn More!
- Rhode Island Integrated Water Quality Monitoring and Assessment Reporting
- Massachusetts Integrated Lists and Other Reports
- Connecticut Integrated Water Quality Report to Congress
- RI DEM Cyanobacteria Fact Sheet (pdf)
- Aquatic Invasive Plants (RI DEM)
- MA fish advisories
- Aquatic Invasive Plants in MA lakes
Posters:
- 2013 Assessment Poster (pdf)
- 2012 Assessment Poster (pdf)

Freshwater Quality
There are almost 2,800 miles of rivers and 44,000 acres of lakes in the Narragansett Bay region. These fresh waters are a critical resource, providing habitat for fish and wildlife, exceptional opportunities for recreational boating, fishing and swimming and drinking water for almost two million people.
Watershed Counts based its water quality analysis on the Rhode Island, Massachusetts and Connecticut 2010 state water quality assessments. Under the Federal Clean Water Act, states are required to adopt water quality standards for their surface waters. These standards define the goals for a waterbody by designating its uses and setting criteria to protect those uses. They then look at water quality through a series of lenses, evaluating specific water quality parameters to decide whether the water is safe for swimming and boating (the recreation use), whether water quality will allow fish and other aquatic animals to live and thrive (the aquatic life use), whether it is safe to eat fish caught from the water (fish consumption) and whether the water is safe to drink (drinking water use). In keeping with the states’ 2010 water quality assessment determinations, Watershed Counts partners decided to present the information by ranking water quality as acceptable (blue), partially acceptable (yellow) and unacceptable (red) based on a combined evaluation of three uses — aquatic life, recreation and fish consumption — for each river. River segments that were not assessed (no or insufficient data) are colored gray.
In general, water quality is in the best shape in the less developed, headwater regions of the Narragansett Bay watershreds. Since the health of the major rivers is strongly affected by the health of the streams that feed into them, this is good news. But it is also a cautionary tale. Development pressures can be high in the very areas where the high quality tributary streams flow. Maintaining undeveloped buffer land adjacent to streams and wetlands to filter runoff from roads and lawns, placing road crossings and culverts so flow and movement of fish and other river animals is not restricted, and minimizing impacts to wetland areas are some actions that are being employed to protect these headwater streams. Controlling point source discharges is also an on-going priority for all the rivers. The impact of urban development in headwater areas can be seen in the Blackstone watershed. The city of Worcester, MA is located in the river's headwaters, and the impact of the city's wastewater and urban stormwater runoff degrade the river’s water quality.
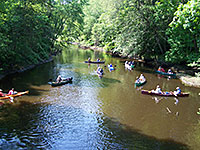
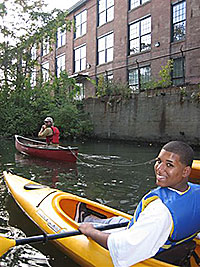
Freshwaters throughout the region provide exceptional recreational opportunities for canoeing and kayaking. The Wood-Pawcatuck and Taunton watersheds are regionally renowned for their paddling opportunities. Recreational uses are met in only 19% of the river miles in the Narragansett Bay watershed (29% in Rhode Island) and in 35% of the lake acres in the Narragansett Bay watershed (73% in Rhode Island).
Is it safe to eat the fish? Fish consumption is unassessed in 66% of the river miles (96% in Rhode Island) and 46% of the lake acres (83% in Rhode Island). Rhode Island does not routinely sample for fish tissue contamination but relies on data collected by EPA researchers, site specific studies and a limited sampling program. Most Rhode Island lakes monitored were found to have elevated levels of fish contaminants. Massachusetts has a statewide fish advisory for mercury, cautioning pregnant women, woman who may become pregnant and children under 12 years of age to not eat freshwater fish. Because the Massachusetts statewide advisory encompasses all fresh waters, these waters cannot be considered as ‘fully supporting’ the fish consumption use. Detailed recommendations for individual waterbodies (pdf).
The Watershed Counts freshwater quality survey included an assessment of invasive plants and the emerging problem of cyanobacteria. Invasive plants were found in 88 waterbodies in Rhode Island and 189 waterbodies in the Massachusetts portion of the watershed. According to the report, “Rhode Island Freshwater Lakes and Ponds: Aquatic Invasive Plant and Water Quality Concerns. A Report to the Governor and Rhode Island General Assembly” (pdf) of February 2012, “The largest cause of impairment was the presence of aquatic invasive plants affecting 6,345 acres which equates to about 1/3 of all lake acreage in Rhode Island. The growth of aquatic invasive plants was found to have degraded the native aquatic habitat conditions. It is notable that in many cases, aquatic invasive plants are thriving in lakes that otherwise exhibit good water quality conditions. In such cases, the degradation of the lake condition is not directly related to a water pollutant but rather is attributable to the excessive growth of an invasive plant.”
Cyanobacteria, also known as blue-green algae, grow naturally in many waterbodies throughout the world, including in freshwater waterbodies in the Narragansett Bay watershed. Under certain conditions, the algae may undergo rapid growth, called an algal bloom. Blooms are often related to an over abundance of nutrients and warm weather. Cyanobacteria produce a number of nuisance compounds, including natural toxins. In sufficient quantity, these toxins can make a lake unsafe for recreational and other uses. In Rhode Island, the state Department of Environmental Management works cooperatively with the Rhode Island Department of Health to monitor waterbodies and issue health advisories when conditions are unsafe. The Massachusetts Department of Public Heath is responsible for the work in the Massachusetts portion of the watershed. Watershed Counts found that 24 waterbodies in Rhode Island and seven waterbodies in Massachusetts had confirmed cyanobacteria blooms in the past 3 years.
Freshwater Quality - Lakes and Ponds: 2013 Assessment
Status and Trends: Water quality is acceptable in only 18% of the lake acres assessed in the Narragansett Bay watershed (30% in Rhode Island). In the Narragansett Bay watershed 34% of the lake acres are not assessed for aquatic life and 21% are not assessed for recreational uses. Forty-six percent of the lake acres are not assessed for fish consumption. Eighty-eight waterbodies in Rhode Island and 189 waterbodies in the Massachusetts portion of the watershed have invasive plants. Twenty-four waterbodies in Rhode Island and seven waterbodies in Massachusetts had confirmed blue-green algae (cyanobacteria) blooms in the past three years.
Management: Protecting and, where needed, restoring the water quality conditions in lakes will require greater collaboration by state resource managers, local communities, lake associations, dam owners, property owners and those who use lakes for recreation and other purposes. Current lake water quality management challenges include infestations of aquatic invasive species, nutrient enrichment, mercury in fish tissue and the emerging issue of blue-green algae.
Freshwater Quality - Rivers and Streams: 2013 Assessment
Status and Trends: Water quality is acceptable in only 21% of the river miles assessed in the Narragansett Bay watershed (26% in Rhode Island). In the Narragansett Bay watershed, 40% of the river miles are not assessed for aquatic life and 39% are not assessed for recreational uses. Sixty-six percent of the river miles are not assessed for fish consumption. In the Rhode Island portion of the watershed, 96% of the river miles are not assessed for fish consumption.
Management: Investments in wastewater treatment upgrades have resulted in improvements to water quality, particularly at Rhode Island treatment plants. Treatment upgrades are slower in the Massachusetts portion of the watershed. Storm water runoff is a major source of pollution to all the freshwater. Both Rhode Island and Massachusetts have programs in place to address storm water pollution, but storm water discharges continue to pollute large segments of the watershed. Additional water quality monitoring is needed to fill assessment gaps.
Freshwater Quality - Rivers and Streams: 2012 Assessment
Status and Trends: Water quality is acceptable in only 12 to 43 percent of the river miles assessed. Between 10 and 34 percent of the river miles are not assessed for aquatic life and recreational uses. Almost no river miles are assessed for fish consumption
Management: Investments in wastewater treatment upgrades has resulted in improvements to water quality, particularly in RI treatment plants. Treatment upgrades are slower in the MA portion of the watershed. Stormwater runoff is a major source of pollution to all the freshwater. Both RI and MA have programs in place to address stormwater pollution, but stormwater discharges continue to pollute large segments of the watershed.
Narragansett Bay Watershed
Note: All maps and charts are in Adobe Acrobat format
Maps:
- River and Stream Water Quality Status (29" x 35" map, 12MB)
- Lake Water Quality Status (29" x 35" map, 12MB)
- Aquatic Invasive Species and Public Shoreline Access (29" x 35" map, 12MB)
Charts:
- Narragansett Bay Watershed: River Water Quality
- Narragansett Bay Watershed: Lake Water Quality
- Rhode Island: River Water Quality
- Rhode Island: Lake Water Quality
- River Water Quality in Major Watersheds:
- Lake Water Quality in Major Watersheds
Blackstone River Watershed
For more information on the Blackstone River watershed:
- Blackstone River Watershed Council/Friends of the Blackstone
- Blackstone River Watershed Association
- Blackstone River Coalition
- Blackstone River Valley National Heritage Corridor
Maps:
- Blackstone River and Stream Water Quality Status (25" x 33" map, 2.9 MB) (letter size map, 1.9 MB)
- Blackstone Lake Water Quality Status (25" x 33" map, 828 kb) (letter size map, 754 kb)
Charts:
Pawtuxet River Watershed
For more information on the Pawtuxet River watershed:
Maps:
- Pawtuxet River and Stream Water Quality Status (25" x 33" map, 2.2 MB) (letter size map, 481 kb)
- Pawtuxet Lake Water Quality Status (25" x 33" map, 497 kb) (letter size map, 474 kb)
Charts:
Taunton River Watershed
For more information on the Taunton River watershed:
Maps:
- Taunton River and Stream Water Quality Status (25" x 33" map, 3.3 MB) (letter size map, 2.4 MB)
- Taunton Lake Water Quality Status (25" x 33" map, 1 MB) (letter size map, 916 kb)
Charts:
Wood-Pawcatuck Rivers Watershed
For more information on the Wood-Pawcatuck watershed:
Maps:
- Wood-Pawcatuck River and Stream Water Quality Status (25" x 33" map, 2.7 MB) (letter size map, 1.7 MB)
- Wood-Pawcatuck Lake Water Quality Status (25" x 33" map, 455 kb) (letter size map, 417 kb)
Charts:
Woonasquatucket River Watershed
For more information on the Woonasquatucket River watershed:
Maps:
- Woonasquatucket River and Stream Water Quality Status (25" x 33" map, 1 MB) (letter size map, 604 kb)
- Woonasquatucket Lake Water Quality Status (25" x 33" map, 180 kb) (letter size map, 163 kb)
Charts:
- Woonasquatucket River Watershed: River Water Quality
- Woonasquatucket River Watershed: Lake Water Quality
Freshwater Indicator Working Group
Watershed Counts development of freshwater indicators was led by a dedicated working group that met regularly to develop the assessment. The working group included representatives from the following organizations:
- Wood-Pawcatuck Watershed Association
- Woonasquatucket River Watershed Council
- Blackstone River Coalition
- Taunton River Watershed Alliance
- RI Department of Environmental Management
- MA Department of Environmental Protection
- EPA Region 1
- Audubon Society of Rhode Island
- Massachusetts Audubon Society
- URI Watershed Watch
- Narragansett Bay Estuary Program
- Coastal Institute
Freshwater Quality: Meeting Agendas, Minutes, Follow-Up
- January 8, 2013 meeting on Freshwater Quality and Flow Indicators
- Agenda
- Meeting Notes
- Flow and Freshwater Quality, a presentation by Meg Kerr, NBEP
- Cyanobacteria in Northeast Lakes, a presentation by Bryan Milstead, US EPA
- Freshwater Quantity and Demand, a presentation by Q Kellogg, URI Coastal Institute
- Mapping Aquatic Invasives, a presentation by Katie DeGoosh, RI DEM, Office of Water Resources
- September 13, 2012 meeting with Mark Mattson, MA DEP
- January 26, 2012 Meeting
- January 11, 2012 Meeting
- What's the Score?, a presentation by Linda Green
- January 4, 2012 Meeting
- Assessing Surface Waters in Massachusetts, a presentation by Therese Beaudoin of MA DEP
- Mass DEP Rotate Watershed Monitoring Cycle Map (JPEG image)
- Meeting Minutes (December 15, 2011)
- Meeting Minutes (November 22, 2011)
- Follow up email after October 19, 2011 meeting
- Note to WC Partners (October 12, 2011) (Word document)
- Meeting Minutes (September 28, 2011) (Word document)
- Meeting Agenda (September 28, 2011) (Word document)
From MA DEP, Therese Beaudoin:
- Blackstone River Water Quality Report Card 1998 (Part 1) (Part 2)
- Blackstone River Pollution Sources 1998 (Part 1) (Part 2)
- Blackstone River Pollution Indicators 1998 (Part 1) (Part 2)
- Blackstone River Pollution Metadata 1998 (Part 1) (Part 2)
- SMART Monitoring Program Report Card Color Codes
- SMART Monitoring Program Metadata Levels
- SMART Monitoring Program Source Codes
- SMART Monitoring Program Water Quality Screening Chart
- The River is the Report Card of the Watershed, a presentation by Therese Beaudoin of MA DEP


